
What is MTF, and why does it matter for lens selection?
MTF (Modulation Transfer Function) is the single most important metric for predicting how sharp and detailed your lens images will be. Higher MTF = better contrast at fine detail — directly impacting detection accuracy in machine vision, ADAS, and medical imaging. A good rule of thumb: target MTF >40% at the Nyquist frequency of your sensor.
MTF describes how well a lens transfers contrast across a range of spatial frequencies. A perfect lens retains 100% contrast (MTF = 1.0) at all frequencies — real lenses lose contrast as detail gets finer. This article explains how to read MTF graphs, what values to target, and how to use Sunex’s interactive MTF Simulator.
When evaluating or designing an imaging system, one of the most important (and often misunderstood) specs is the Modulation Transfer Function (MTF). MTF describes how well a lens can transfer contrast at varying levels of image detail (spatial frequencies). In other words, it shows how sharp the image will be.
But just reading an MTF graph isn’t always enough. That’s why we created the MTF Simulator—a visual tool that helps you see how different MTF values affect image clarity.
How do you read an MTF graph?
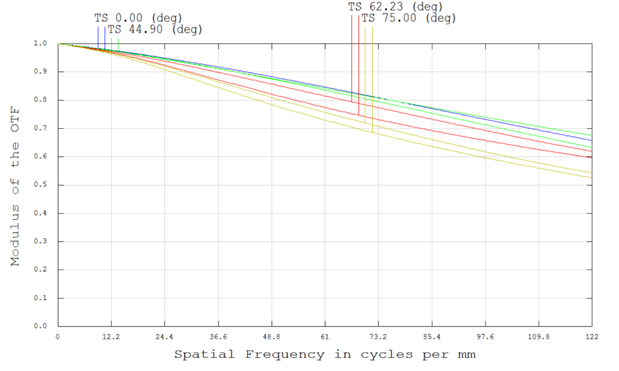
An MTF graph plots contrast (0–1) on the Y-axis versus spatial frequency on the X-axis (in cycles/mm). Some key features to look for:
- Higher MTF curve = better contrast at that level of detail
- Sagittal (S) vs. Tangential (T) curves indicate performance symmetry
- FOV performance variation
MTF curves provide a quantitative idea of how a lens will perform at certain spatial frequencies. Our MTF simulator connects the quantitative to the qualitative, making it easy to understand the impact a value of MTF will have on your image.
How can I use the Sunex MTF Simulator to evaluate a lens?
Here’s how it works:
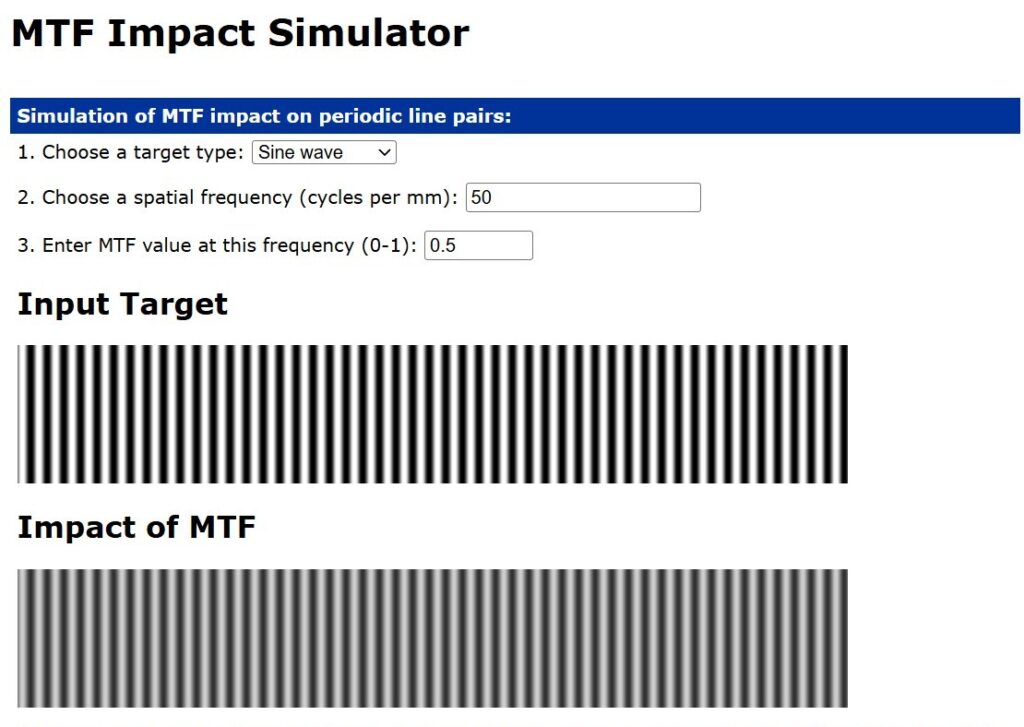
- Choose your target type:
– Sine wave or square wave
– For square waves, the simulator assumes harmonic MTF values drop off as 1/frequency. This is generally accurate at mid to high frequencies but may not reflect low-frequency, high-MTF edge cases. - Select a spatial frequency:
– Explore coarse vs. fine detail. Input the required spatial frequency. - Set an MTF value between 0 and 1:
– Simulate how much contrast your lens retains at that level of detail.
The simulator shows a perfect input target and a corresponding image impacted by your selected MTF value, helping you visualize how contrast loss affects clarity.
Visualize the impact of MTF using our interactive MTF Simulator.
What MTF value should I target for my imaging application?
MTF is more than a theoretical metric—it’s the key to understanding how your lens and sensor work together to produce sharp, high-contrast images. By interpreting MTF graphs, matching sensor specs, and accounting for application-specific trade-offs, you can make smarter imaging decisions.
Ask our Sunex support team to get more information on MTF and try our MTF Simulator to get a visual feel for how optical performance translates to image quality.

